Some years ago, when I was a goalkeeper for the University of Alberta Golden Bears soccer team, we were playing against the UBC Thunderbirds. It was a tight game. UBC was an aggressive team, pumping ball after ball into the box that I, as the keeper, was expected to corral and control. At some point in the second half, with the score tied 0-0, one of their wingers gathered a long, searching pass that took him deep into the corner to my left. He had time and space for a cross, with our defenders late getting to him. UBC forwards flooded the box as the winger got ready to curl the ball in. Elbows were being thrown and people were getting blocked out. The ball was on the verge of coming into the danger zone. It was a moment of maximum tension.
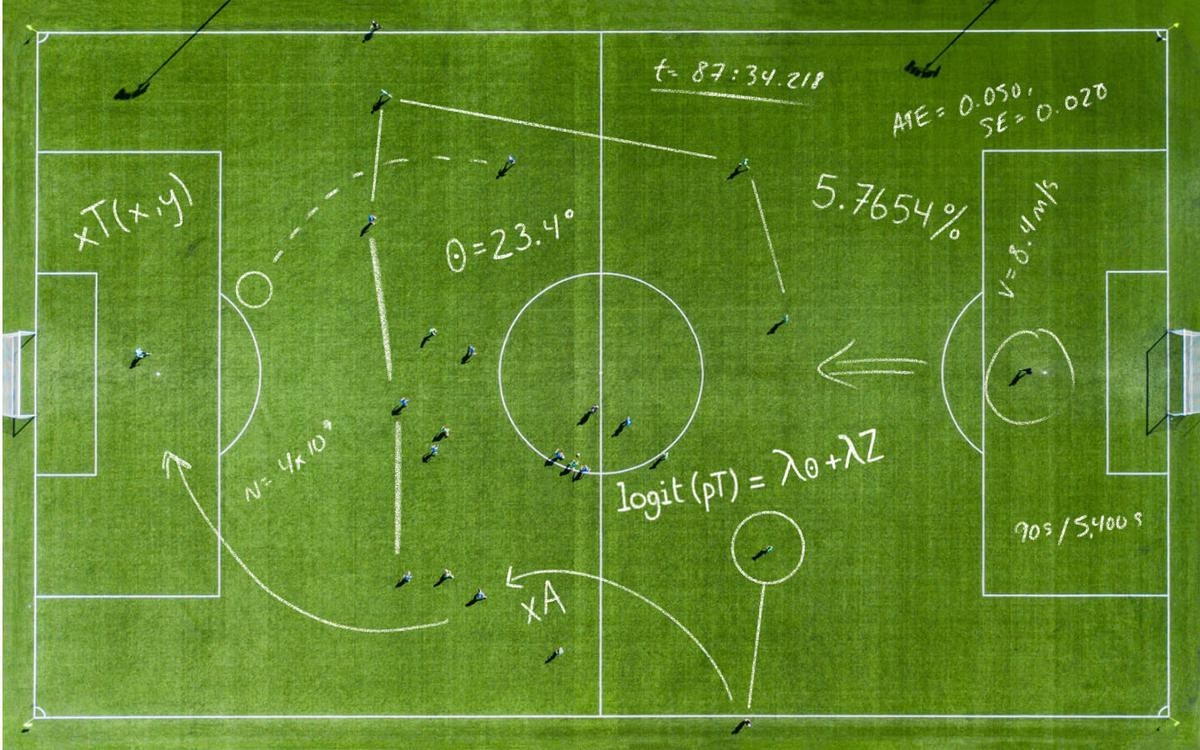
It was at this point that a question of Bayesian analysis – a formal mathematical framework that allows for the continuous revision of assumptions as new information makes itself available – popped into my head and I pondered the precise spatiotemporal conditions that might induce a player to cross the ball in the first place. It struck me that the UBC player was using a standard statistical regression model, < logit(pT) = λ0 + λZ >, to inform his decision to cross. The most impactful covariates would clearly have been his proximity to the end line and the number of his teammates inside the attacking rectangle in relation to the number of my teammates there to counteract invasive tactics. Causal investigation would no doubt reveal, via ATE = 0.050 with standard error 0.020, that to cross in this situation would lead to a meaningful shot on goal 5.7654 per cent more often than continuing to dribble or passing back. Based purely on the inputs available, I therefore anticipated a cross and felt confident that such statistical analysis gave me a much better chance of a successful goalkeeper outcome. A save, in other words.
Sure enough, the guy laid a searing, curling cross into the box, a real pellet of a ball. I got a hand on it, got punched in the head, couldn’t control the ball as I fell, the ref didn’t call the obvious foul, and UBC scored off my mishandle. We lost 1-0 and I started the next game on the bench.
So much for Bayesian analysis.
All of the above actually happened. Well, except for the bit about the in-game meditation on statistical analysis. I can’t honestly recall a single thought that was going through my head in that moment, but whatever it was, I feel quite sure it didn’t have anything to do with regression models. I mean, who thinks about things like that when it comes to sports?
Tim Swartz, that’s who. Such statistical thoughts and reflections are, in fact, often precisely what goes through his head when he’s watching, for instance, a soccer game. “Although the truth,” says Swartz, a professor of statistics and actuarial science at Simon Fraser University, “is that usually I end up focusing on stuff that just kind of bugs me, because I think, ‘Why are they doing that?!’”

It was many years ago that Swartz, an ardent sports fan and athlete since his youth, began looking at the ways in which statistical analysis could be applied to sport, and he did so with a group of grad students. This involved sports such as bowling and basketball. But then Swartz began to wonder how the methods he was using elsewhere in his work could be used to glean new insights into athletic performance. Long a soccer fan, he started to wonder how data could be used to analyze patterns in that sport. The issue, however, was that advanced data was not readily available. It was different with what he calls discrete sports, such as baseball or golf, in which a ball is hit by a single player.
Bill James was a well-known statistician who applied his theories to baseball, and this had an impact on the field. But that wasn’t the sea change. “People were somewhat interested in sports analytics,” says Swartz, “but everything changed in 2003, when Michael Lewis published Moneyball.”
Get our weekly newsletter – the people, places, and ideas revealing where Canada is headed.
This was the book that documented how the scrappy upstart Major League Baseball team the Oakland A’s made themselves competitive, through the savvy application of data analysis, with big-market teams like the New York Yankees and Boston Red Sox. The public buy-in on data in sports went through the roof when the movie version of Moneyball came out in 2011. It didn’t hurt that Brad Pitt became the face of the data analytics cause.
“All of sudden,” says Swartz, laughing, “everybody became interested in sports analytics!”
But that wasn’t the only thing important to this surge, says Swartz. Around the same time, a major development was underway in the realm of data tracking. Up to this point, all the obvious things in a sport were kept track of. In baseball, it was hits, runs, strikeouts. In hockey, it was goals, assists, stops. In soccer, it was passes made and completed, tackles, shots, saves. But with the advent of tracking capabilities via advances in video technology and sensors (such as computer chips attached to jerseys), statisticians – and teams – could avail themselves of a whole new world of data. Swartz refers to this stream of information as spatiotemporal data, meaning you can know precisely where a player is in both space and time. You can know to an inch and a millisecond the location of every player, how far they ran, how fast, where on the field they spent the most time, what patterns produced the most possession, shots, goals and, therefore, wins.
“It was Johan Cruyff, the great Dutch player who was at Barcelona and Ajax,” says Swartz, “who once said, ‘You only have the ball at your feet 90 seconds of a match. What do you do during the rest of the game?’ So now we know, because we have the tracking data. I know where everybody is all the time. The number of problems that you can address are really only limited by your imagination. Statisticians were not really interested in sports prior to tracking data, because we only had summary and box score data. There’s not much you can do with that. But the world is your oyster with tracking data.”
Statisticians now could examine an array of activities that told a much deeper story about what was happening on the playing field. The complexities of sport began to be revealed through data analysis, especially in sports that Swartz calls “invasion sports,” meaning sports in which one team is attempting to invade the territory of another team. Tennis, golf, badminton, baseball – these are not invasion sports. Hockey, football and basketball are invasion sports. And, of course, the invasion sport that is the world’s biggest game is soccer.
It all led to Swartz studying the minutiae of things like crosses and throw-ins in soccer. Which does lead one to wonder, what precisely is there to study about throw-ins, and what is to be gained from the analysis?
“The throw-in paper is one I like,” says Swartz. “We used causal analysis for that one, which means using randomization to understand cause and effect.” At this point, Swartz spent many minutes explaining causal analysis and causal inference, a process I will condense into this: tracking data allows statisticians to measure the variables of athlete numbers and locations. What they produced in the paper was a selection of heat maps showing the good and not-as-good areas for throw-ins so as to retain possession.
“We found that the applied benefit comes from either throwing the ball a little bit backward or employing the really long throw. Backward seems a bit counterintuitive, but because they are trying to prevent a goal, the opposing team usually has more players loaded up toward their net. Going backwards allows you to retain possession, and that’s very important in soccer,” Swartz says. His tracking data, which captured the positioning of players measured 10 times per second, showed that, on average, backwards throw-ins lead to an extra two shots per 100 throw-ins.
“But going long is good, too,” he adds. His paper shows that in 100 throw-ins, long ones resulted in roughly four more shots.

Of course, soccer is not the only sport undergoing this data transformation. There is no longer a single team in any of the four major North American sports leagues – the NFL, NBA, NHL and MLB – that does not have an analytics person on staff. Many have full analytics departments. In fact, as the FIFA World Cup opened, the Stanley Cup Finals concluded, won by a team, the Carolina Hurricanes, that has done something no NHL team has ever done before: it hired the data nerd to run the team. That would be the Hurricanes’ GM, Eric Tulsky, who has a PhD in chemistry and worked in nanotechnology in Silicon Valley. While in that career, Tulsky began blogging on hockey and furthered a concept he called “possession metrics,” which is not about drug dealing but is in fact related to keeping control of the puck as you enter the opposing zone. This was opposed to mindlessly following the time-honoured, and apparently pointless, practice of the “dump and chase,” which was also not about drug dealing. Tulsky’s thesis – which has largely been borne out, and especially with more skilled players – was that increased possession leads to a greater positive shot attempt differential. Tulsky was eventually hired as a consultant for various NHL teams and ended up doing part-time analytical work for the Hurricanes in 2014. He kept moving up the food chain and was named GM in 2024. Tulsky never played hockey at any serious level. In fact, there is no indication he played any sport to any particular degree, though his resumé does note that he was on the competitive Ultimate Frisbee team while studying at Harvard.
But all this is music, or numbers, to Tim Swartz’s ears. He and a colleague published a paper a few years ago analyzing why it was that teams that were down a goal heading into the dying seconds of a hockey game always waited until there were only 30 seconds left before they pulled their goalie for an extra attacker. Through data analysis and simulation experiments, they concluded that it was much more logical to pull your goalie with three minutes left. Once published, that paper sifted through various conferences and minor leagues before entering the mainstream, and now NHL teams regularly pull their goalies when behind with upward of three or four minutes left.
This is but one example of how statistical analysis has changed sport. There are dozens if not hundreds more. NBA teams now shoot considerably more three-pointers than in the past because analysis has revealed that, despite it being much farther out to shoot from, the benefit of the potential extra point far outweighs the risk of shooting from deeper territory. Soccer, meanwhile, is seeing a much greater rate of goals scored from set pieces such as free kicks and corner kicks than in the past because analysis of simulated outcomes is helping teams create new ways of positioning players to generate scoring chances through controlled scenarios rather than through the unpredictability of continuous play.
Set pieces are, by the way, one thing Swartz is going to be watching for at this year’s World Cup. So much of sport, he says, is about incredibly small margins, the tiny details that become the difference between winning and losing when so many other elements, such as talent, are comparable. The set pieces alluded to above will be very likely to tip the balance during the games, Swartz predicts. He’ll also be watching out for “parking the bus,” a highly defensive structure that teams might employ once they have gained a slender lead. In a nutshell, parking the bus is a strategy that calls for every defending player on the pitch to compress into their own third of the field and closer to the middle, making it extremely difficult for the attacking team to get through. The imagery is meant to evoke the parking of a bus in front of the goal.
His analysis, Swartz says, has shown that parking the bus just doesn’t work, citing a paper he co-wrote in 2023 called “Should You Park the Bus?” “The tracking data looked at the convex hull – an invisible, elastic boundary around the outermost players of a team, which gets compressed when the bus is parked – and all they’re doing is getting more defensive and less ambitious. I’d love to see teams not do that. It’s like Bill Parcells, the football coach, who said, ‘The only thing the Prevent Defense does is prevent you from winning.’”
As for Canada’s chances in this World Cup, Swartz is hopeful but realistic. He has followed their team’s progress closely for many years and was excited for the 2022 World Cup team to provide some surprises, given their sheer exuberance, energy and pace. “I just remember that Mexico, a top, top nation, had no answers for them during the qualifying. They were just too strong, too fast.” But injuries have hit the team hard in the run-up to the event, primarily to the team’s talisman, Alphonso Davies, but to others as well. “They’re at that peak age where they could surprise teams, but with the injuries and everything, there’s not as much time to round into form. Maybe it can happen. But I’m not as hopeful as I was for this team maybe about a year ago.”
Swartz expects them to advance from their group and make it into the knockout stages, but given that he’s a data guy, he also acknowledges the role of fate. “There’s just a lot of luck in soccer, too, right? It’s an offside by a few inches here, a goalpost there. The difference between winning and losing at this level is just so razor-thin.”
No matter what happens, though, Swartz will be watching for trends and patterns and, of course, things that bug him. He’ll be looking at throw-ins, corners, crosses, free kicks, buses getting parked. It’ll all be there, as well as no doubt some new wrinkle that will require analysis and that pro teams will invest millions in to gain even the tiniest statistical advantage. That’s just the way sport is today. It’s a numbers game.