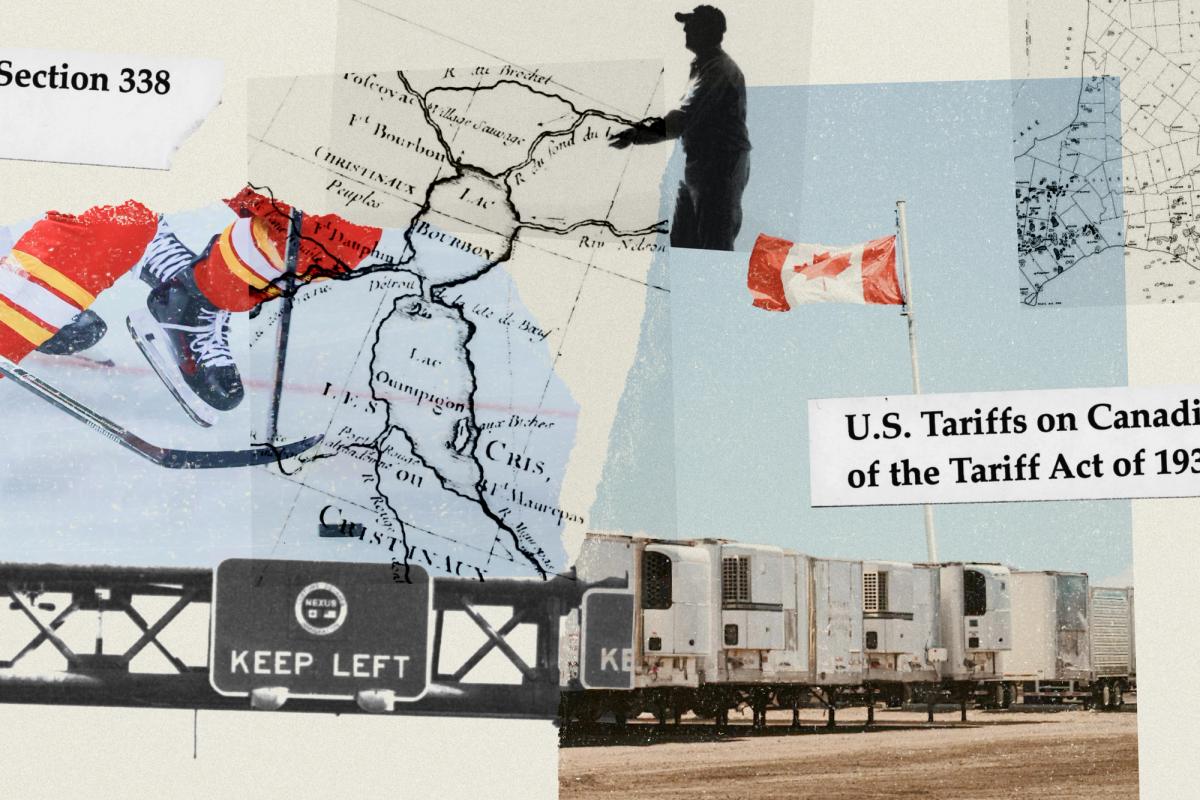
Trying to understand the effects of the U.S. tariff announcements on Canadian goods over the past two years has been a bit like watching the clouds to predict a lightning strike: who were the most vulnerable business owners and was anyone keeping an eye on them? In May 2025, a geography and urban planning team at the University of Toronto decided to find out. The interactive map they built – using information from a deep list of sources including StatsCan, the Canadian Chamber of Commerce, the U.S. Department of Commerce and its Census Bureau – measures the impact of tariffs across Canada, right down to the community level. It’s a surprisingly addictive tool that lets users zoom in to see how industries and their employees have fared, searchable by date and sector, in places as small as Hanley, Sask. (pop. 540) and the Montreal neighbourhood of Westmount. The project is led by Karen Chapple, director of the School of Cities, and Tara Vinodrai, who directs U of T’s Master of Urban Innovation program. Here, Vinodrai shares lessons she is drawing from the map’s shifting palette.
What does the map tell us about how Canadian businesses are coping during the trade wars?
Our project maps vulnerabilities based on current tariff policies, so it doesn’t account for what specific businesses have done to pivot following tariff announcements. What this means is that we can’t say if the actual trade impacts are worsening in any region; we’re only assessing where the vulnerabilities lie. But overall, the story has been that as the U.S. has added tariffs over time, the vulnerabilities have worsened.
There’s a large unaffected swath on the map that spans northern Saskatchewan, northern Manitoba and northern Ontario. Why?
These areas aren’t entirely unaffected, but they do appear to be less vulnerable than other parts of Canada. That’s because there have been a number of industries that have so far remained relatively immune to tariffs, which includes extractive industries related to the mining of critical minerals.
Which province has the most complex story to tell? At a glance, it looks like either Ontario or Quebec?
Yes, since most of the tariffs focus on manufactured goods and Ontario and Quebec are part of Canada’s industrial heartland, they are both places where multiple layers of tariffs have the potential to affect local economies. Almost all of the categories of tariffs are in play in those provinces. But if I had to pick, I would say Ontario, because of its larger and more diverse sets of manufacturing activities, alongside steel and the more recent dairy and alcohol tariffs.

Get our new book for free.
Subscribe to our newsletter and we’ll mail you a printed copy.
What’s that big, red, hard-hit spot in the middle of Quebec?
The area around Chicoutimi and Dolbeau-Mistassini has a fair amount of aluminum-related activity and downstream industrial supply chain activity. But some of these patterns are driven by CUSMA-compliance estimates and U.S. export intensity, which may be shifting.
Walk me through a finding I might not clock as a casual user.
My favourite aspect is the way the map tells parts of the story by showing where employees live. They aren’t necessarily living right beside the factory or the processing plant or the wood shop that’s being affected. And that, in turn, might spread the economic impact on employees across the region, especially as you get out into rural areas where people might be living even farther away [from their place of work]. I’m trained as an economic geographer and I’ve done a lot of work on regional economies and how they’ve changed over time. The tariffs have been an external shock to [local] economic systems, and a lot of that impact has been rural.
Do you expect we’ll start to see changes in internal migration patterns as trade impacts play out? For instance, when the economy falters in Atlantic Canada, we often see shifts in population to Alberta.
That’s a much slower structural process. What we might see is the trading pattern shift, and if the trading patterns shift, there’s going to be some growth and decline that come out of it.
Who needs to be following this work, and what do you want them to do with the results?
We’re hoping that Mark Carney and economic development officials and policymakers at all three levels of government are paying attention to help target and guide policy and program responses.
Is there a cautionary tale they might extract from the data?
For better or worse, the Canadian economy is geographically concentrated and regionally specialized. What that means more generally is that, if there’s an impact of any kind on a particular sector – dairy, automotive – it’s going to have an enormous impact on the region. And that’s a vulnerability that exists even without the tariffs.